
This blog is written by Rebecca G. W. Mueller and is about the powerful effect of images as an instructional tool. Read more about Rebecca at the bottom of her post.
Let’s do a quick exercise.
Take a moment to revisit several recent blog posts.
How many blogs included visuals? What type of visuals? Did you pay much attention to the visuals as you read the blogs? Did you think about how the visuals interacted with the text and communicated their own meaning?
We are surrounded by visuals – from emojis and selfies to infographics and data charts. Visuals are an important communication tool that we must read just like we do text, but readers do not always bring the same critical eye to visuals as they do words. Readers often deem visuals as objective depictions of information and forget that, for example, a photographer makes many decisions about how to best capture a moment just as a speech writer carefully selects their words.
A key facet of literacy in social studies classrooms is strengthening students’ abilities to critically engage with visuals (Callahan, 2013; Roberts & Brugar, 2017). Because students’ worlds are often saturated with visuals, teachers may presume that students have the skills to read them, but one’s ability to select the most flattering filter does not necessarily transfer to considering a political cartoon’s symbolism. Critically engaging with visuals requires substantial vocabulary and background knowledge, particularly around symbols, artistic conventions, and statistics. Below, I introduce some tools teachers can use to scaffold students’ work with visuals and discuss how building this capacity supports disciplinary literacy.
Useful tools
The Stanford History Education Group (SHEG) has an extensive array of resources, lessons, and assessments that support content and disciplinary literacy. SHEG recently turned its attention to civic online reasoning and has developed materials that address skills necessary for sense-making in a visual-filled digital world, including evaluating photos and evaluating data. All visitors can view student-friendly crash course videos, but a free-account is required to access some resources (e.g., assessment tools, rubrics, sample responses), most of which are most appropriate for middle or high school students. Using the three-question scaffold Who’s behind the information? What’s the evidence? and What do other sources say?, students develop the disposition to encounter visuals with healthy skepticism.
Both the Library of Congress and National Archives have document analysis tools and support materials to guide students’ work with visual sources. Both sites provide a general guide and specific guides that are tailored for particular source types, including charts and graphs, maps, photographs, and political cartoons. For example, the Library of Congress’ basic tool prompts students to observe, reflect, and question. The analysis tool modified for use with political cartoons includes guiding questions such as What do you see that might be a symbol? What was happening when this cartoon was made? and What methods does the cartoonist use to persuade the audience? These documents, which include versions appropriate for different readiness levels, prompt students to utilize core literacy practices while also emphasizing the influence of form and function on how we create and read visuals.Project Zero’s Thinking Routine Toolbox includes an array of strategies suitable for various disciplines and ages. The Toolbox has identified strategies that are well suited to exploring art, images, and objects. One of my favorites is See, Think, Wonder because it stresses the importance of looking closely before drawing conclusions and identifying additional information that will strengthen those conclusions. This simple, flexible strategy demands similar practices as the scaffolds described above but with language accessible to all ages.
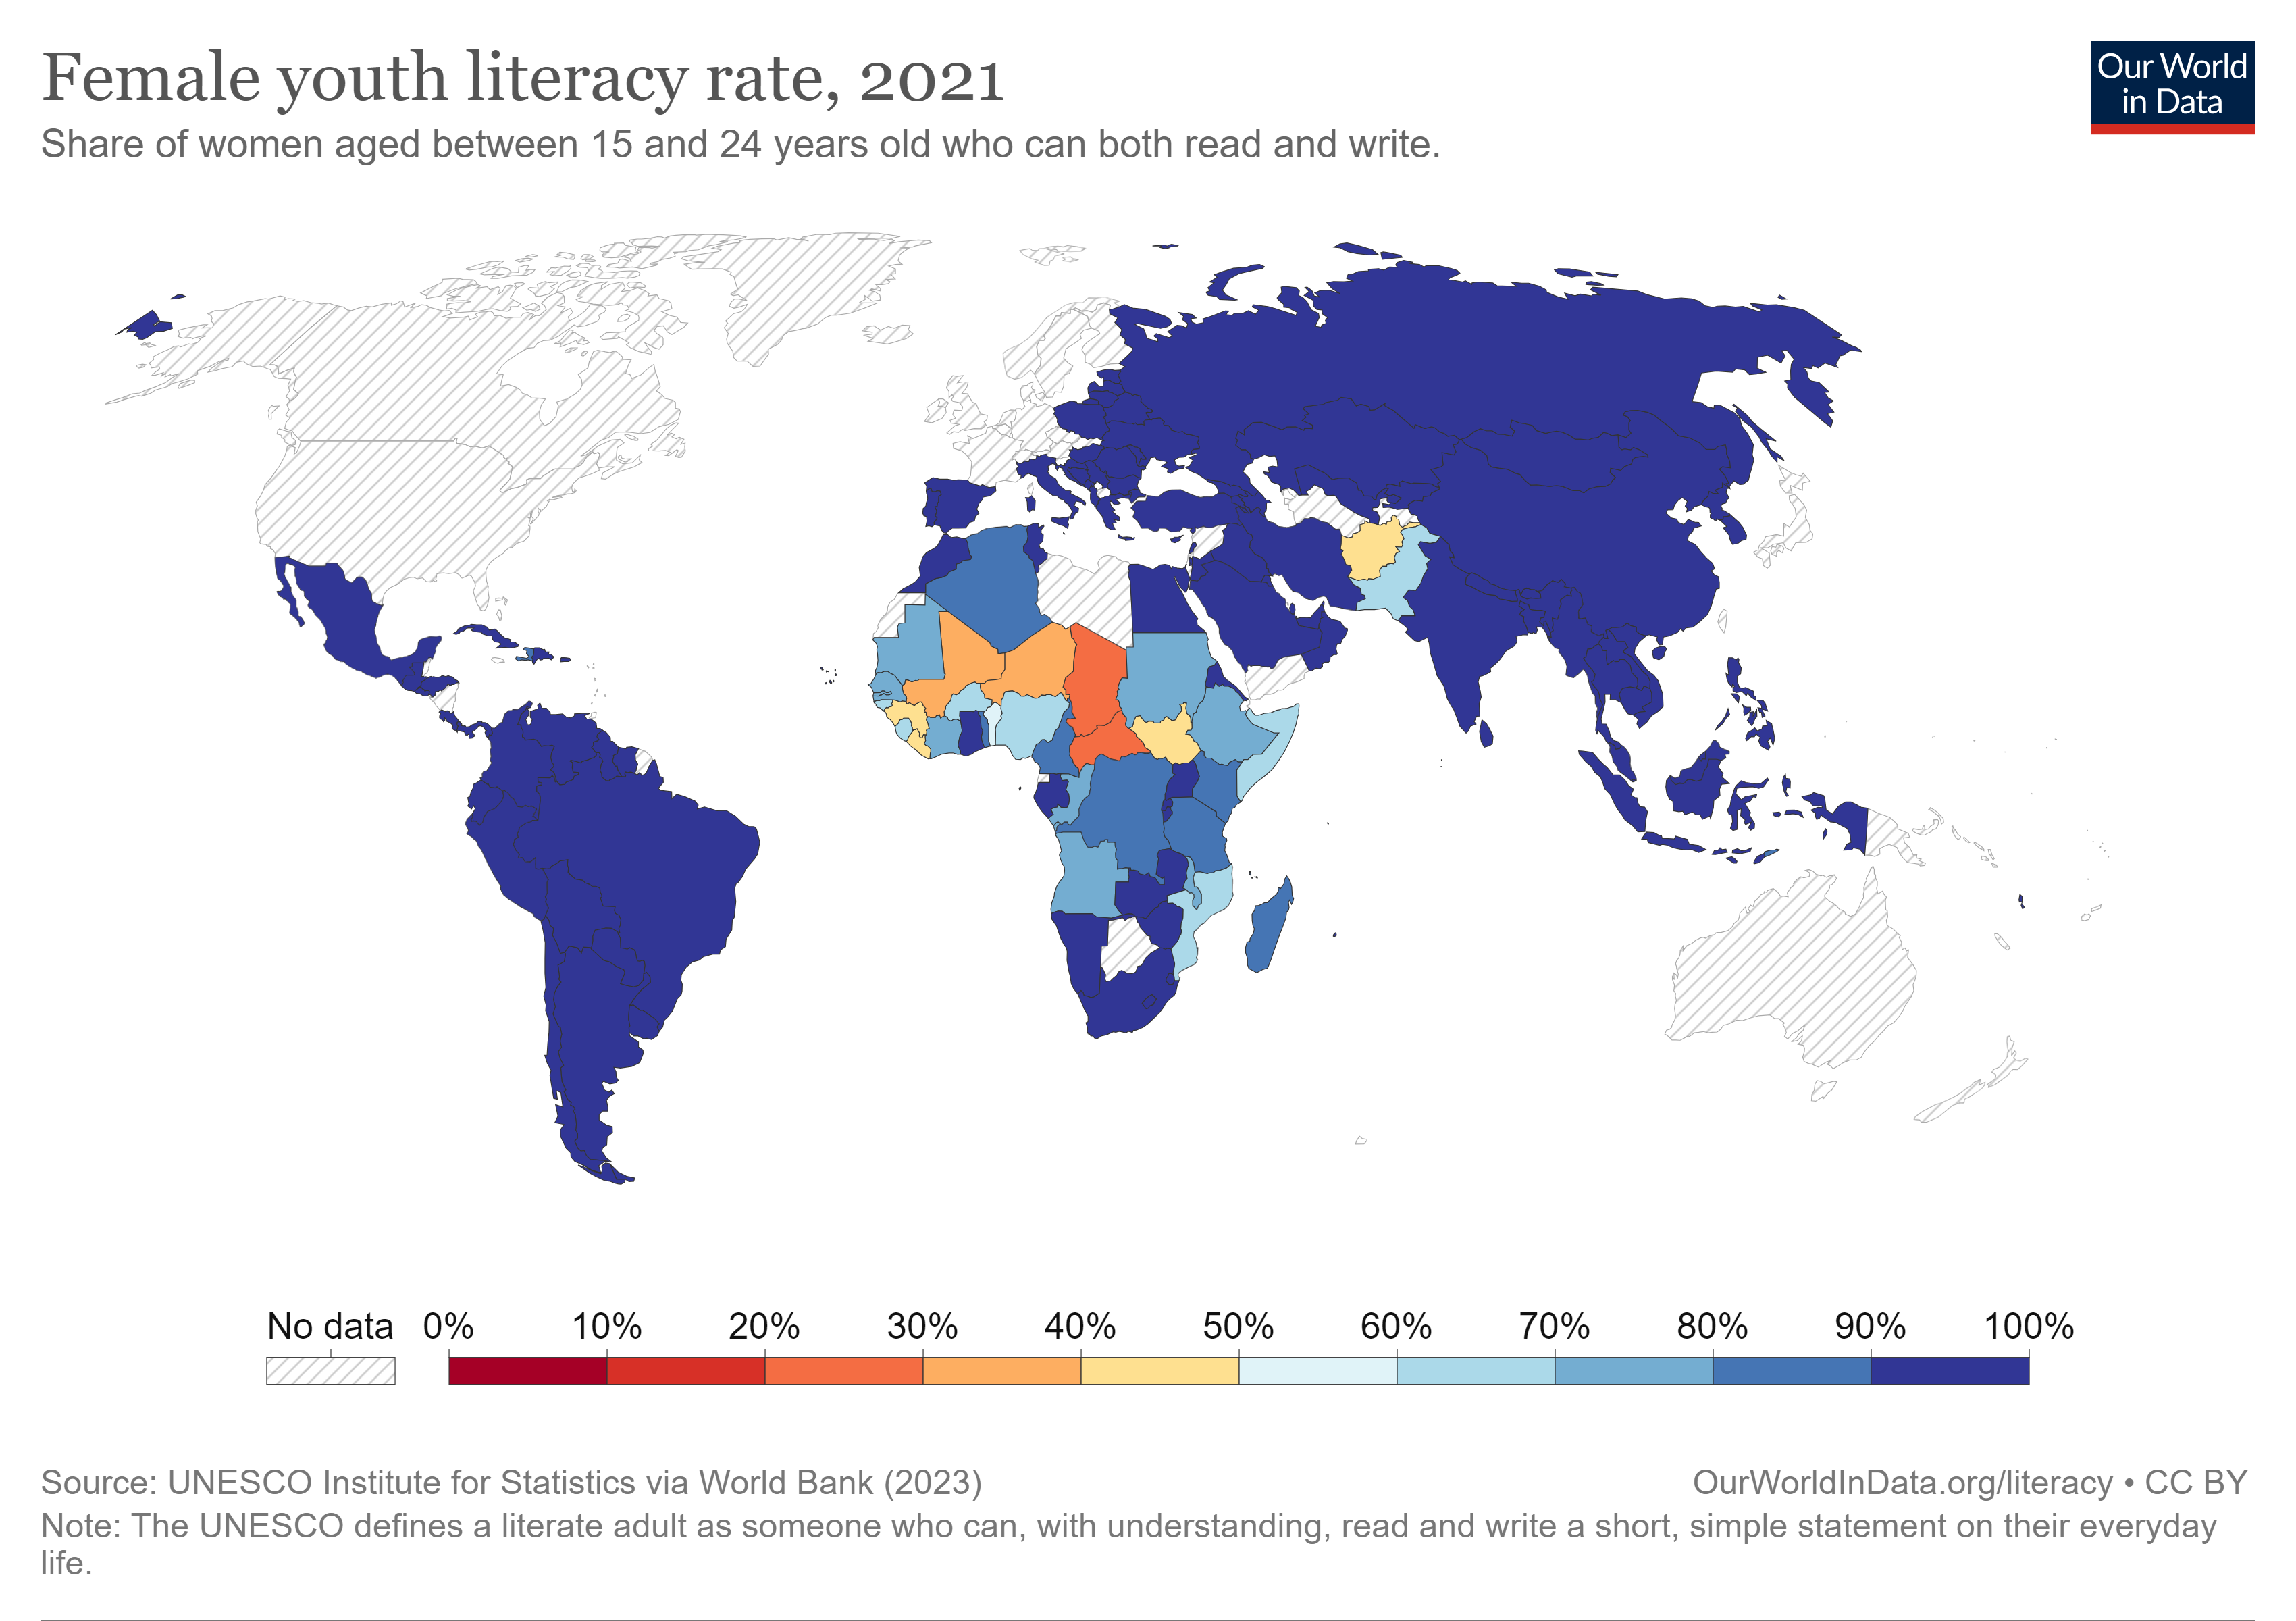
Retrieved from https://ourworldindata.org/literacy
See, Think, Wonder can be paired with Zoom In, which prompts students to consider increasingly larger portions of an image and revise their conclusions based on new information. In both cases, students build the dispositions to root conclusions in evidence, be open to revising conclusions based on new information, and reflect on how their personal experiences and biases may influence the way they interpret visuals.
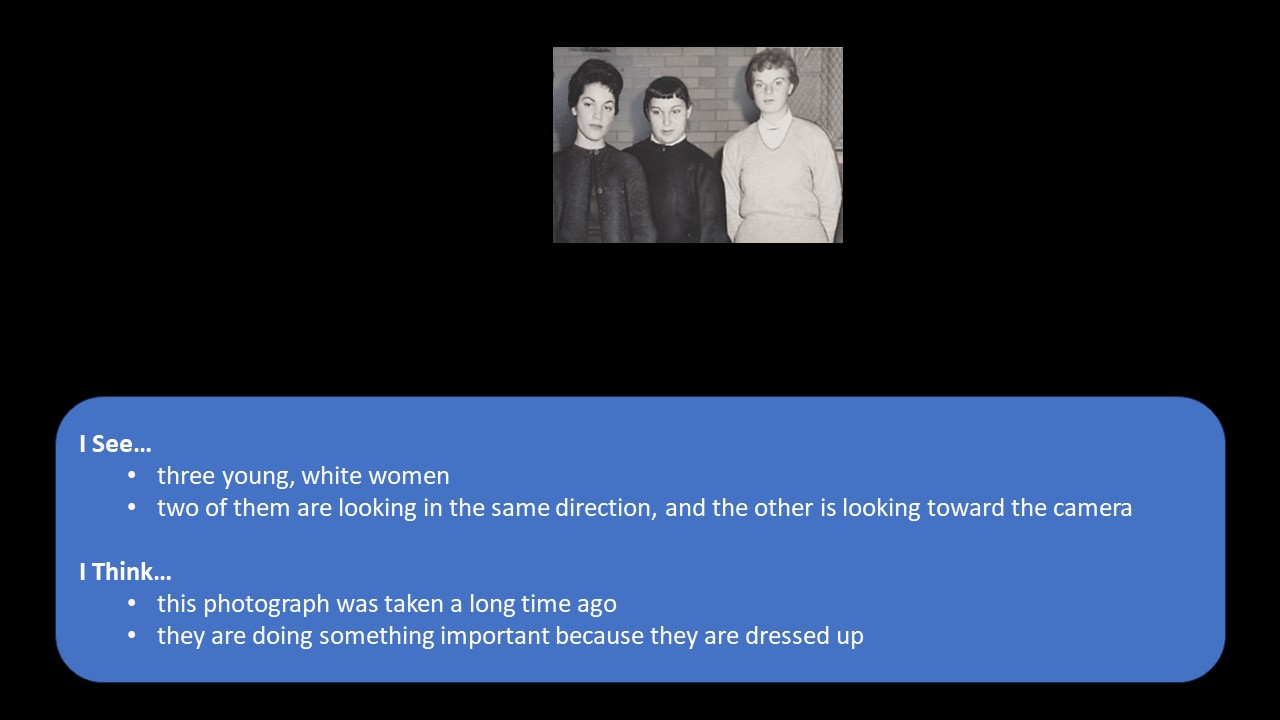
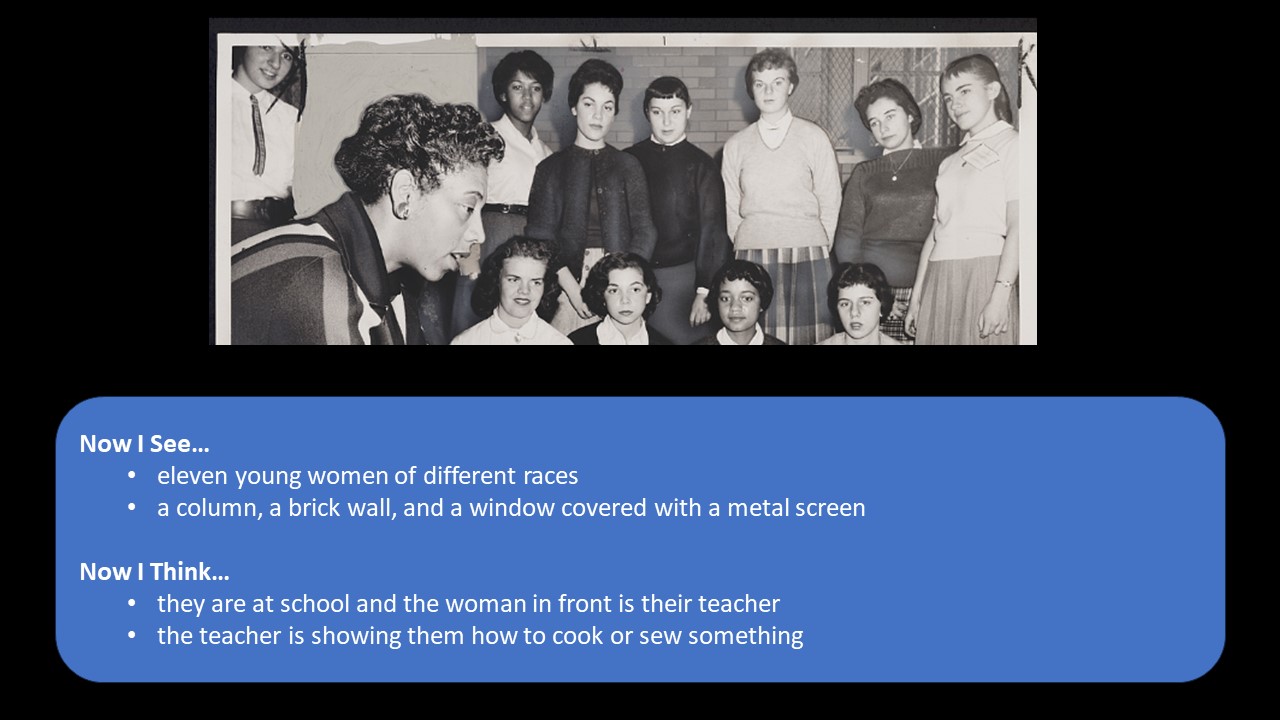
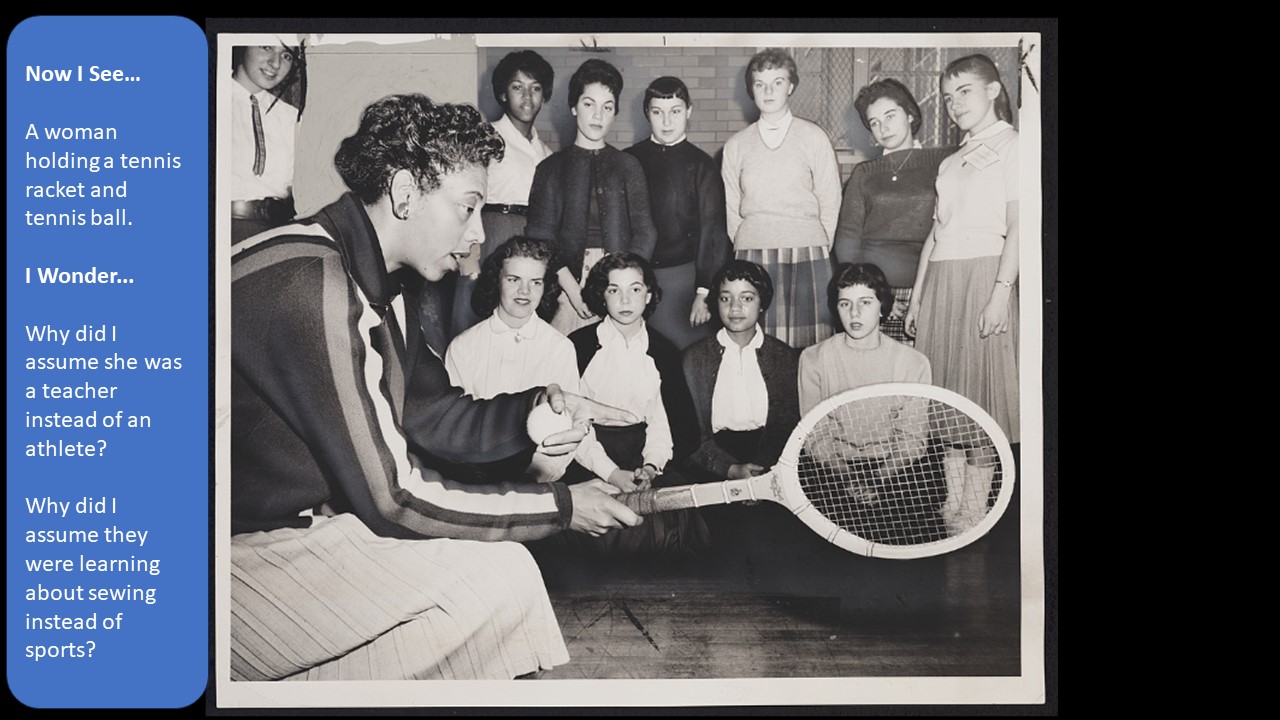
Ford, E., photographer. (1957). Tennis talk Althea Gibson, U.S. and Wimbledon tennis champion, gives some pointers on the game which has brought her international fame. Some 500 students attended the tennis clinic yesterday at Midwood HS, directed by Murray Eisenstadt, varsity coach // World Telegram & Sun photo by Ed. Ford. New York, 1957. December. [Photograph] Retrieved from the Library of Congress, https://www.loc.gov/item/2013650115.
Visual literacy as civic literacy
Researchers affiliated with SHEG’s Civic Online Reasoning project have argued that “the health of a democracy depends on people’s ability to access reliable information” (Breakstone, et al., 2021, p. 505). Because so much of the information we encounter is visual, building students’ visual literacy is fundamental to civic literacy. Utilizing the tools discussed above strengthens students’ awareness of the constructed nature of visuals and their ability to apply disciplinary sourcing practices to better understand how context and intention influence the way we create and read visuals.
References:
Breakstone, J., Smith, M., Wineburg, S., Rapaport, A., Carle, J., Garland, M., &
Saavedra, A. (2021). Students’ civic online reasoning: A national portrait. Educational Researcher, 50(8), 505-515.
Callahan, C. (2013). Analyzing historical photographs to promote civic competence.
Social Studies Research and Practice, 8(1), 77-88.
Roberts, K. L., & Brugar, K. A. (2017). The view from here: The emergence of
graphical literacy. Reading Psychology, 38, 733-777.