This post is written by Schyler Anderson. Read more about Schyler at the bottom of this post.
While teaching science one day, I gave my students what I thought would be a simple task – read an article and answer questions afterward. In my lesson plans, I wrote this as a “warm-up” activity which was only supposed to last about ten minutes. Ten minutes passed and to my dismay, the majority of my students weren’t even attempting the assignment. I walked around the room to check in with students and see what the issue was. The students who weren’t attempting the assignment asked me to read it to them. Once I did, we went through the questions and they were able to answer them with no problem.
The situation listed above occurred frequently in my classroom. In the beginning, I played the blame game and felt that teaching middle schoolers how to read was out of my control and not my job. After seeing my students continue to struggle, I realized this was an area of my teaching that I needed to revisit. I believed that literacy was at the core of science and integral to the success of my students. When researching, I came across the strategy of using graphic organizers. I found that one of the reasons middle school students struggle so much with science literacy is because they have had little exposure to expository writing. Expository writing is filled with complex vocabulary, structured by topics, and has no clear beginning, middle, and end, unlike the narrative writing they were more used to. Graphic organizers help students break down the content into manageable chunks and ensure they grasp what’s most important.
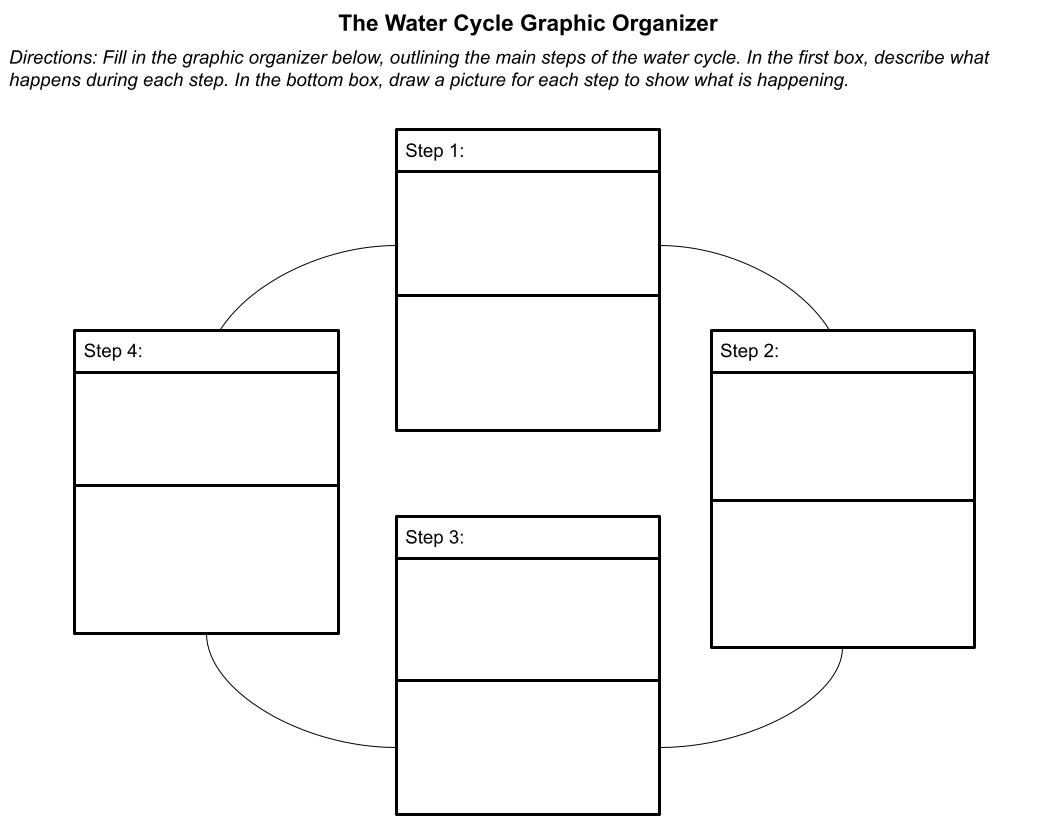
Once I decided this strategy was worth implementing, I approached implementation with a science brain where I created a control group and an experimental group. Both groups took the same pre- and post-assessments. The experimental group learned using graphic organizers and the control group relied on traditional reading comprehension strategies such as skimming and scanning the text, looking at bold words or phrases and reading the questions before reading the text. The groups switched to the next unit so that each group had experience learning content with and without graphic organizers. I was ultimately comparing the growth between each group to see if this strategy really helped improve students’ reading comprehension skills. I created my own graphic organizers based on each topic like the one sampled in the image below. I decided to follow the basic templates of hierarchical, cyclical, conceptual, and sequential graphic organizers where I added titles and phrases to help students understand the organization better.
When looking at the data, I found that this strategy was helpful to my students, particularly those who categorize themselves as poor readers and/or those who were low achievers in science (D or F grade range). Survey data showed me that 67% of my students from Class A and Class B felt that using graphic organizers helped them understand content from the textbook better. They also provided written explanations stating that when using graphic organizers:
- “It helped me because it breaks down everything.”
- “It helped me because it is more organized.”
- “The content is simplified.”
- “It is easier to find the answer.”
I also noticed that my low-achieving students experienced the most growth between the pre-and post-assessment while in the experimental group. For example, the two low-achieving students I focused on experienced a growth of 60 and 40 points when using the graphic organizers. This group of students also responded the most enthusiastically to the strategy. Before graphic organizers, the two focus students loathed completing written work. They both rated themselves as poor readers who are insecure about their reading ability. When comparing this behavior with their behavior during the use of the strategy, it was a 180-degree difference. These two students were writing down and completing the assignments. They were complaining that class was ending too quickly. They became more confident in the short time that I tried this strategy out. You can see for yourself the comparison between the work of my focus student, Ava, below:
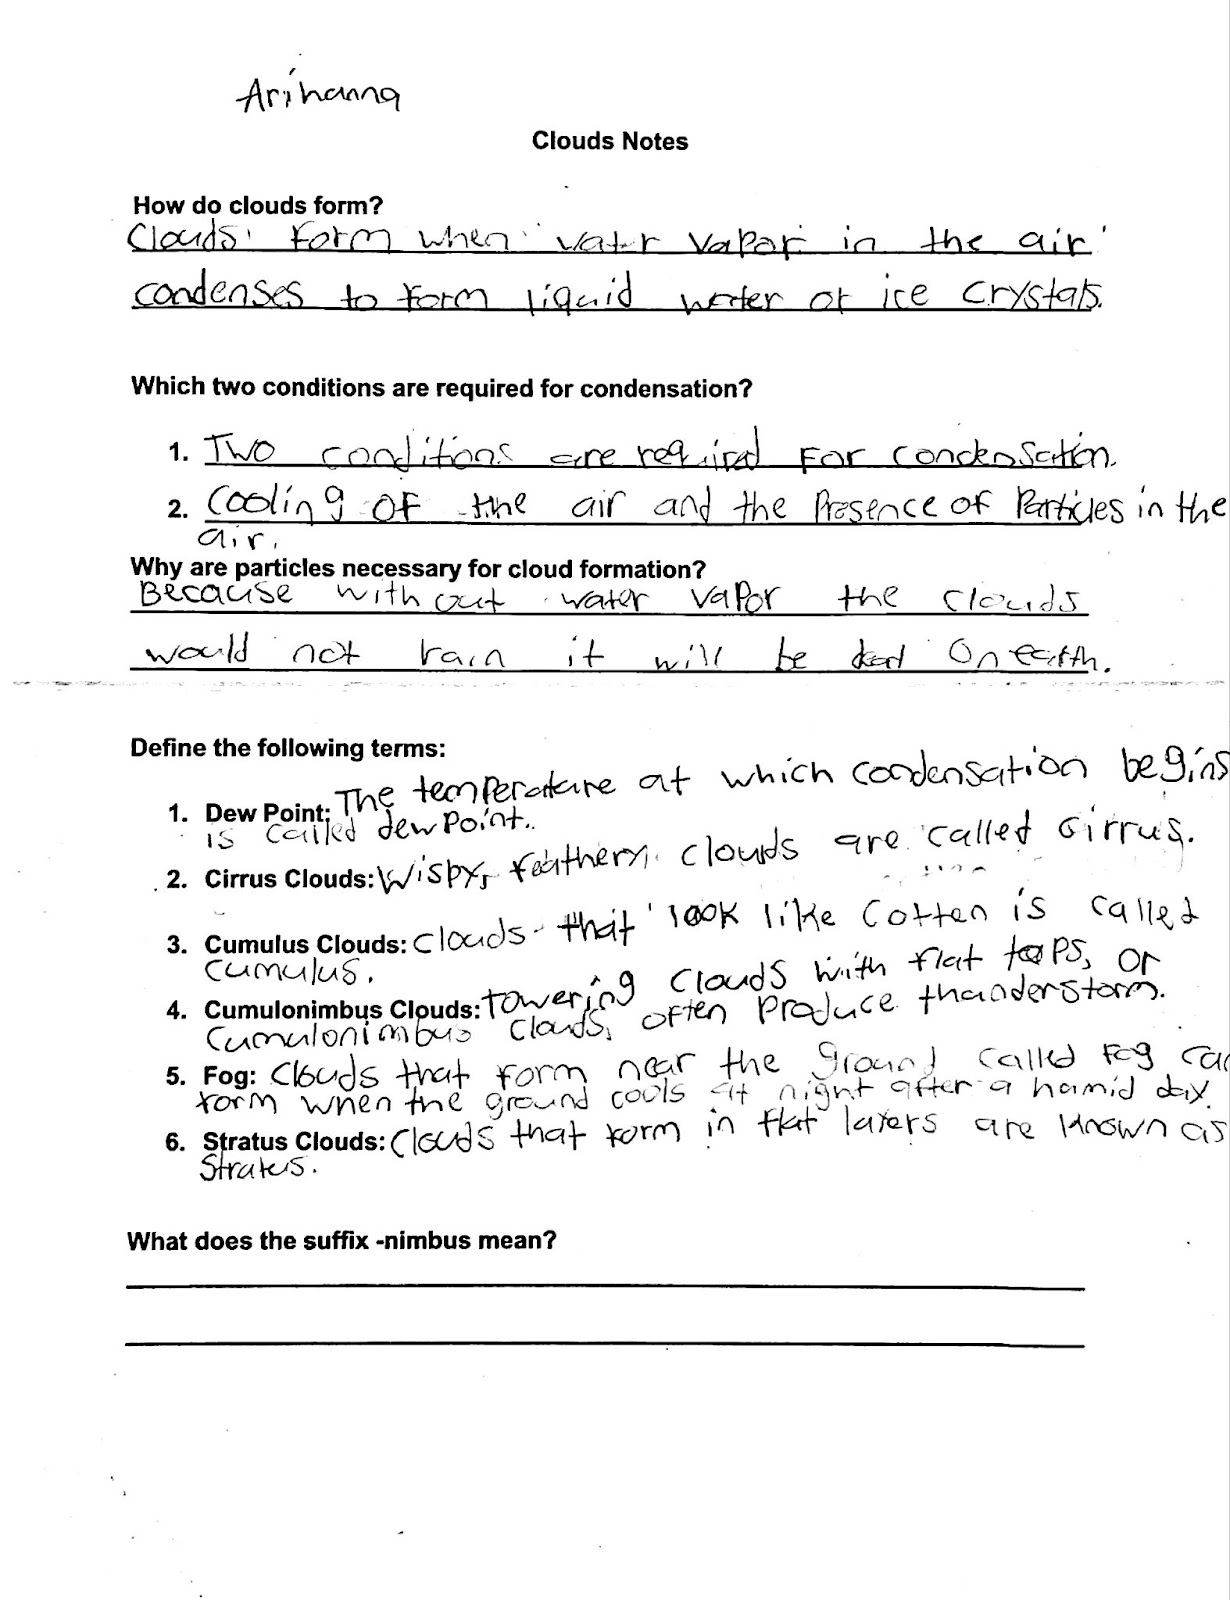
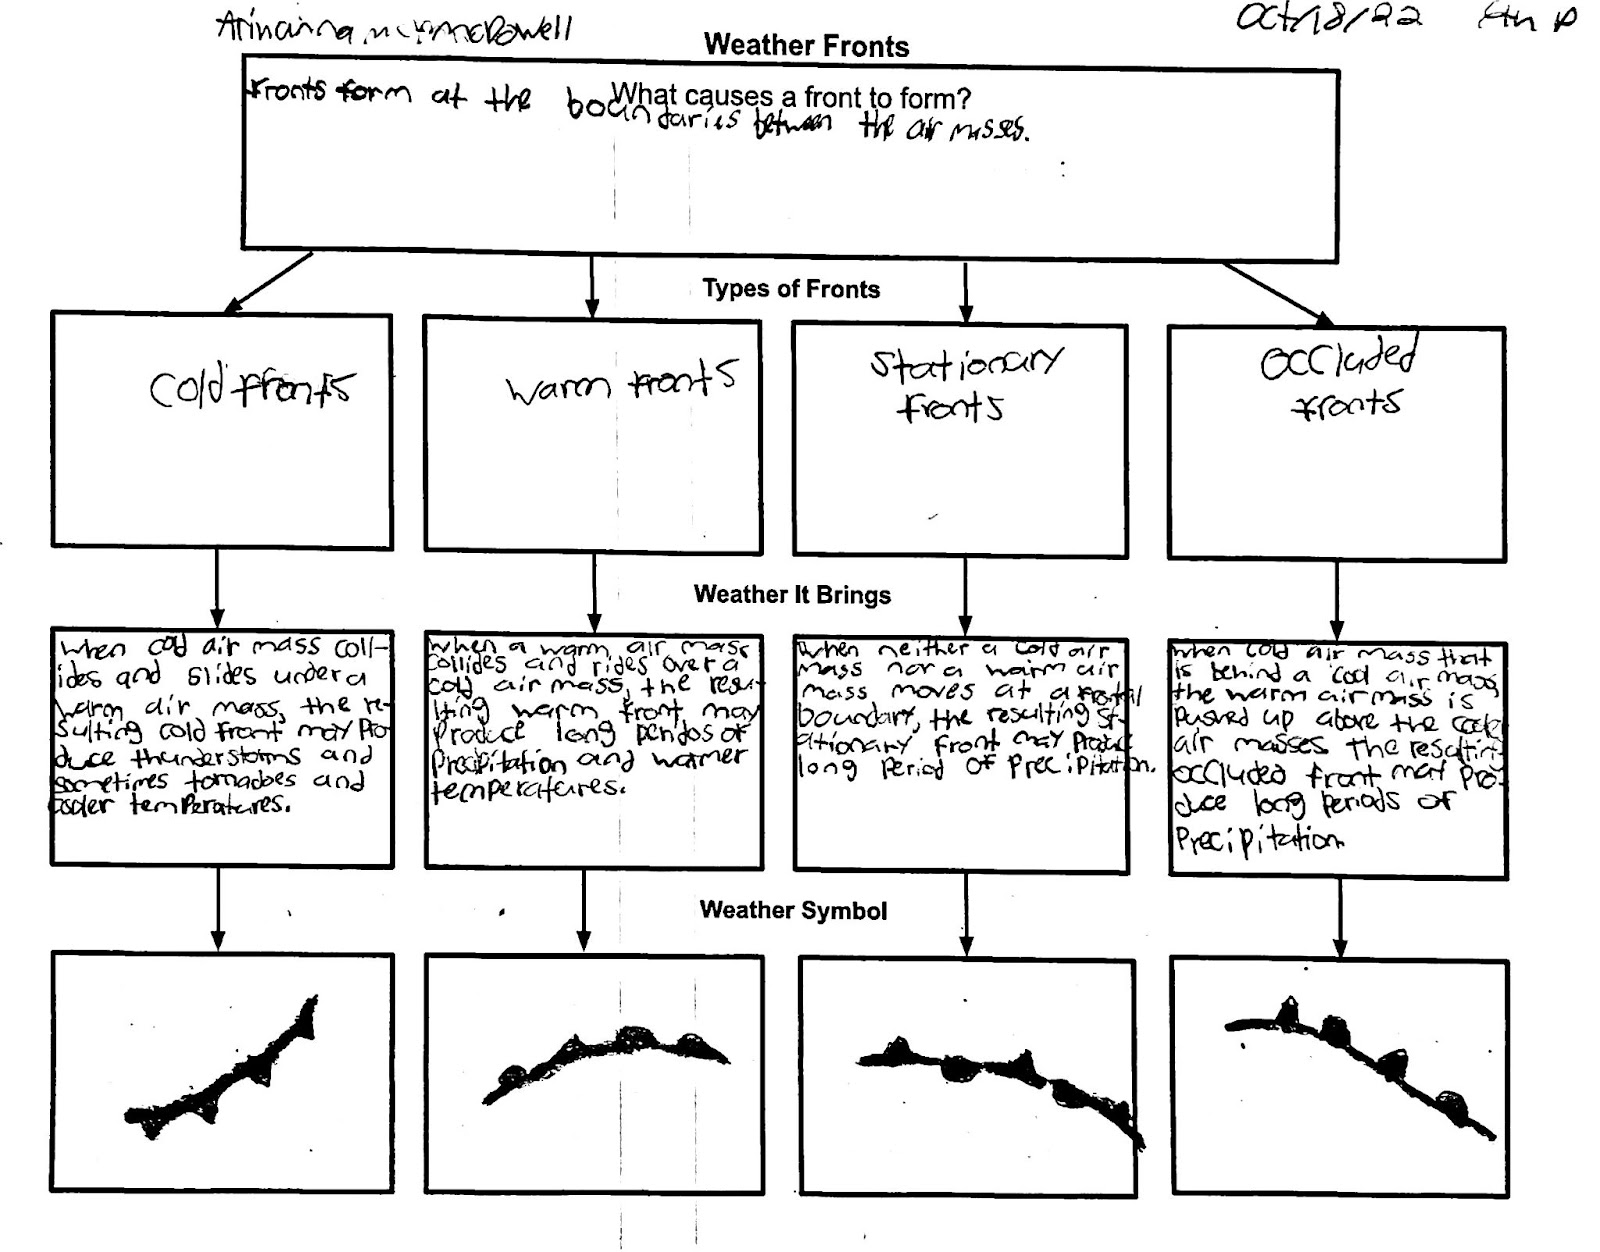
When looking at the notes above, you can see that Ava did not complete the note sheet entirely. The answer to the question, “Why are particles necessary for cloud formation?” is answered incorrectly showing a lack of understanding. The final question is not answered so the notes lack some details. Now compare this with the graphic organizer completed below. Notice that the graphic organizer is entirely complete. Ava took the time to draw out each symbol and color it in. The definitions provided give enough details that Ava could use these notes to help her study or complete an assignment.
While my foray into the world of graphic organizers was short, I find this strategy to be a promising one. This strategy is first and foremost easy to implement. There are numerous templates online or you can create your own using Google Slides or Google Drawings as I did. Simply print them out, explain what goes where, and see how your students do. The second plus to this strategy is that it teaches students how to pull out the important information within a wordy article and how to actually use this information when needed. Finally, this strategy was most effective with my struggling readers and I don’t know about you but If I can find a strategy that helps my struggling students become more successful I will. In conclusion, give graphic organizers a try today or tomorrow and see how they will help your students become better readers of science – and other expository – texts.

My name is Schyler Anderson. I am an educator located in Sumter, SC. This will be my 4th year teaching 6th-grade science. I am a proud USC alumna. I got my bachelor’s degree in middle-level education with a concentration in math and science and my master’s degree in teaching with a focus on PBL.
Cover Photo by Jess Bailey on Unsplash